01 Jun 2021
Philipp Boersch-Supan
citizen science
Tweet this!
This blog post was originally published in the BTO’s Lifecycle magazine
Most adult birds moult all their feathers once a year, which provides an energetic challenge on a par with reproduction and migration. Despite this, moult has been a neglected subject in ornithology and much remains to be learned about how it fits into the annual cycle of birds. Here I highlight the value of recording scores of individual primary feathers.
Documentation of basic moult
data such as the timing, location,
sequence, and completeness of feather
replacement is crucial for any attempt
at unravelling the physiological and
environmental causes of moult and
how these might differ between species
and regions. As changing climates alter
birds’ breeding and migration seasons,
how is the timing of moult changing?
Ringing records provide a critical
source of information and we have been
looking at how we can best make use of
them. Specifically, we are interested in
quantifying the variation in passerine
moult timing and duration, and
investigating potential environmental
drivers thereof. Estimating the date
when moult starts and how long it lasts
in wild bird populations is challenging;
usually the full progression cannot be
observed in individuals. Rather, we
have to infer moult timing across a
population from snapshots of different
individuals throughout the season that
are usually only caught once.
RECORDING MOULT
One of our first insights from this
project is that the way moult is recorded
matters. The guidelines in the Ringers’
Manual allow two types of moult
information. Moult codes consider
moult progression across the entire
bird in broad categories relevant to all
ages, whereas primary scores track the
progression of flight feather moult in
more detail.
SIMULATION
To determine the relative value of these
two approaches, we simulated moult in
a large virtual population of adult birds.
We then sampled this virtual flock as if
we were catching them using different
levels of effort (i.e. numbers of birds
caught over the course of a season) and
noted either the moult code (‘O – old
plumage’, ‘M – active main moult’,
‘N – new plumage following main
moult’) or the scores of the individual
feathers for each (0–5). Finally, we used
a statistical model to estimate moult
timing for each sample. Because we
know how moult progresses in our
simulated population, we can assess
how accurate our statistical estimates
of moult commencement and duration
are using the two recording methods.
Estimating moult dates and
durations is sensitive to when birds are
observed in their moult cycle. Ideally,
records from a season cover birds in
all stages of active moult as well as
those individuals that haven’t started
(code ‘O’, score 0) and those that have
finished (code ‘N’, score 50). We found
that this was particularly important
when using moult codes alone.
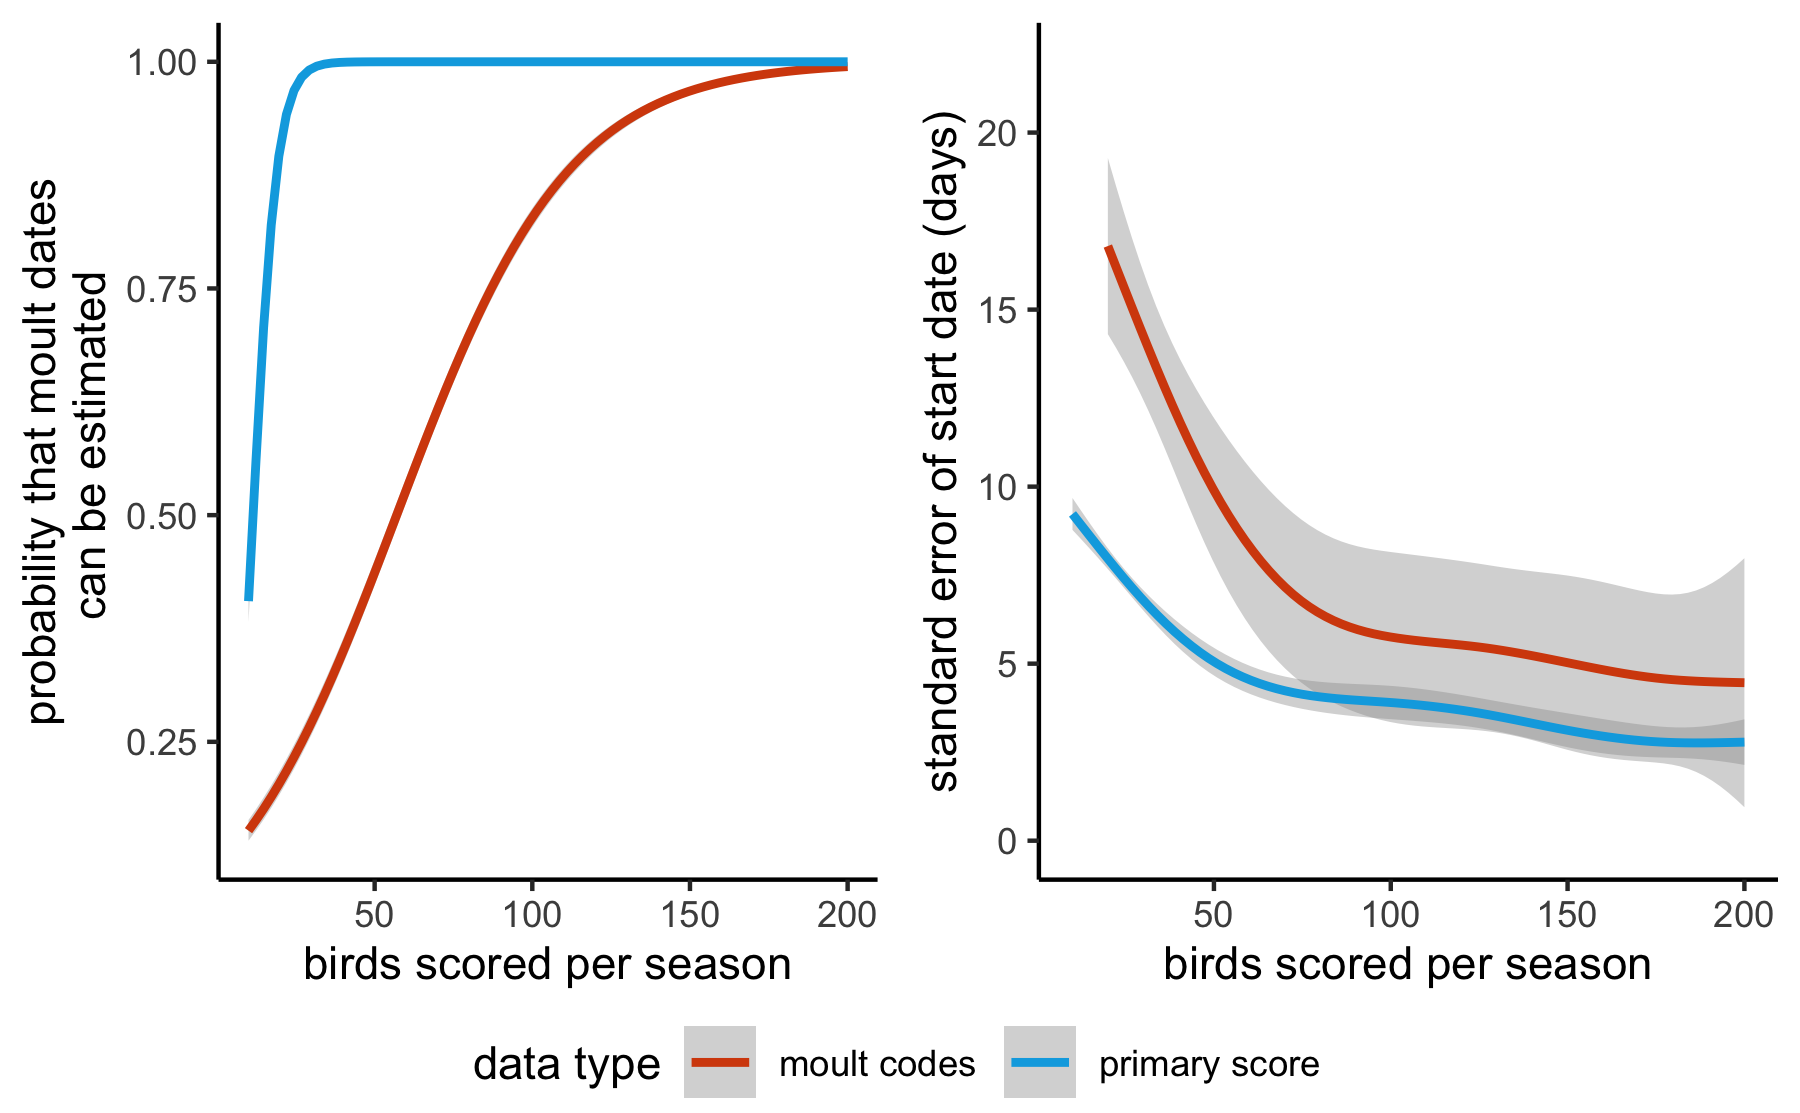
Analyses of moult timing (phenology) based on primary scores require a much smaller
sample size to yield useful results (left), and deliver date estimates with higher precision,
particularly for small sample sizes (right).
RESULTS
On average, a much larger sample of
birds with just a moult code is required
for the phenology model to yield any
results – 50 birds sampled randomly
across the season offers only a 50:50
chance of successfully estimating
moult start date and duration (see
graph). Primary scores hold much
more information, because wing moult
progresses in a near-linear fashion in
many passerines. A random sample
of about 30 scored birds virtually
guarantees reliable estimates of moult
phenology. Further, when estimation
succeeds, the estimated dates and
duration are much more precise for a
given sample size when using primary
scores.
Samples larger than c. 50 individuals
with primary scores yield standard
errors smaller than about five days. For
moult codes, a threefold larger sample
is required to obtain the same level of
precision. Although these numbers
might seem small in a national context,
by the time you start breaking the
sample down by sex, habitat, location…
every record becomes valuable. So, next
time you are processing captured birds
please consider recording a full set of
primary scores, and remember, scores
of pre- and post-moult birds are as
important as those of actively moulting
birds to understand the phenology of
feather replacement.
REFERENCES
Underhill, L. & Zucchini, W. (1988) A model for avian primary moult. Ibis 130, 358–372. DOI
Boersch-Supan, P. et al. (2021) Bayesian inference for models of avian moult timing. Poster presented at EURING 2021. DOI
09 Mar 2021
Philipp Boersch-Supan
disease ecology paper
Tweet this!
Temperature influences the transmission of many diseases, but the effects of temperature variability on the transmission of parasitic diseases are poorly understood.
A new paper co-led by Karena Nguyen (Emory University) and myself and published in PNAS(https://doi.org/10.1073/pnas.2017537118) investigates the influence of water temperature on the transmission risk for schistosomiasis, a disease that affects over 200 million people annually.
Schistosomiasis is caused by parasitic worms which develop in fresh water snails and infect humans and livestock when they come into contact with contaminated water.
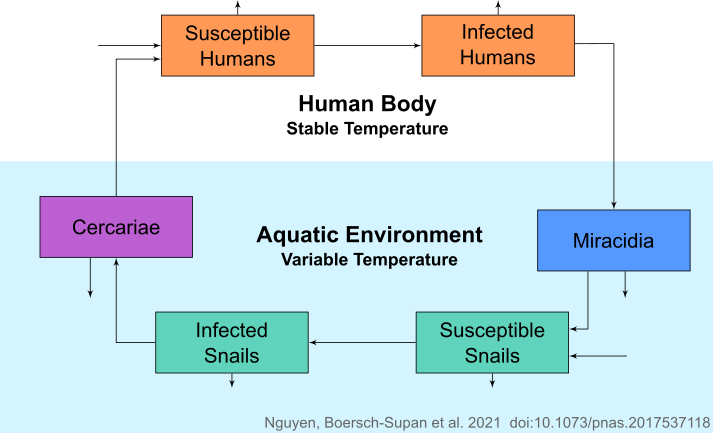
We found that temperature affects each life stage of the parasite and the
intermediate snail differently, and that these differences shape disease transmission and the effects of interventions.
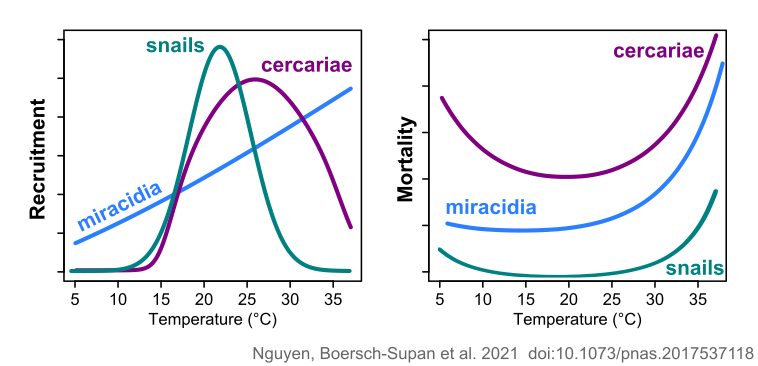
Combining the information on temperature-specific traits in an
epidemiological model, showed that transmission risk peaks when water warms to 21.7 degrees centigrade.
The model also allowed us to simulate interventions
targeting the disease in different ways, for example by treating humans or removing snails.
The simulation results showed that removing snails was the most effective intervention to reduce transmission, especially when applied at low environmental temperatures.
Surprisingly, simulated snail removal also raised the optimal temperature for transmission by up to 1.3 degrees centigrade.
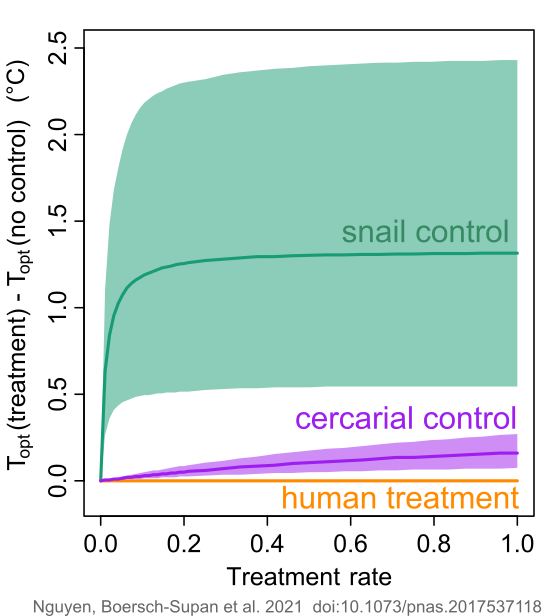
This is because interventions like chemical treatments amplify snail
mortality at all temperatures, and while this decreases disease transmission overall, it also allows the peak
of transmission risk to occur at higher temperatures, which benefit the hatching of parasite eggs.
Our findings can guide public health workers to take regional water temperatures and
their seasonal fluctuations into account when planning interventions that target aquatic parasites and their intermediate hosts.
The paper originated in a “quick statistical question” Karena had about the experimental work for her PhD thesis at the University of South Florida, while I was a postdoc there and at the University of Florida. The project then developed into a fun collaboration that combined experiments, data synthesis and mathematical and statistical models.
Additional authors of paper are Jason Rohr (Notre Dame University), Valerie Harwood (University of South Florida), David Civitello, Rachel Hartman and Sandra Mediola (Emory).
The work was funded by the National Institutes of Health, the National Science Foundation, the Porter Foundation and the U.S. Department of Agriculture.
KH Nguyen*, PH Boersch-Supan*, RB Hartman, SY Mendiola, VJ Harwood, DJ Civitello, JR Rohr (2021)
Interventions can shift the thermal optimum for parasitic disease transmission.
Proceedings of the National Academy of Sciences
doi:10.1073/pnas.2017537118
*joint corresponding authors
28 Feb 2021
Philipp Boersch-Supan
citizen science paper
Tweet this!
A new research paper published with BTO colleagues underlines the importance of rocky shores and sandy beaches for waterbirds in the UK.
The study summarised the results of a citizen science survey scheme - the third Non-Estuarine Waterbird Survey (NEWS III).
The results showed that Oystercatcher was the most abundant species on the open coast, followed by Curlew and Turnstone. Four species - Lapwing, Curlew, Redshank and Turnstone - showed significant abundance declines since the previous survey (NEWS II) in winter 2006/07. A single species - Sanderling - had significantly increased in abundance.
All UK countries have non-estuarine coastal stretches which support high densities of waders, with Scotland being particularly important. Further notable areas are located in north-east England, Orkney, North Wales and Outer Ards in Northern Ireland.
The study was led by Liz Humphries and is published in the journal Bird Study:
EM Humphries, GE Austin, T Frost, H Mellan, PH Boersch-Supan, NK Burton, DE Balmer (2021)
Wader populations on the UK’s open coast: results of the 2015/16 Non-Estuarine Waterbird Survey (NEWS-III) and a review of population trends
Bird Study doi:10.1080/00063657.2021.1884184
21 Apr 2020
Philipp Boersch-Supan
citizen science
Tweet this!
This blog post was originally published on the BTO’s website
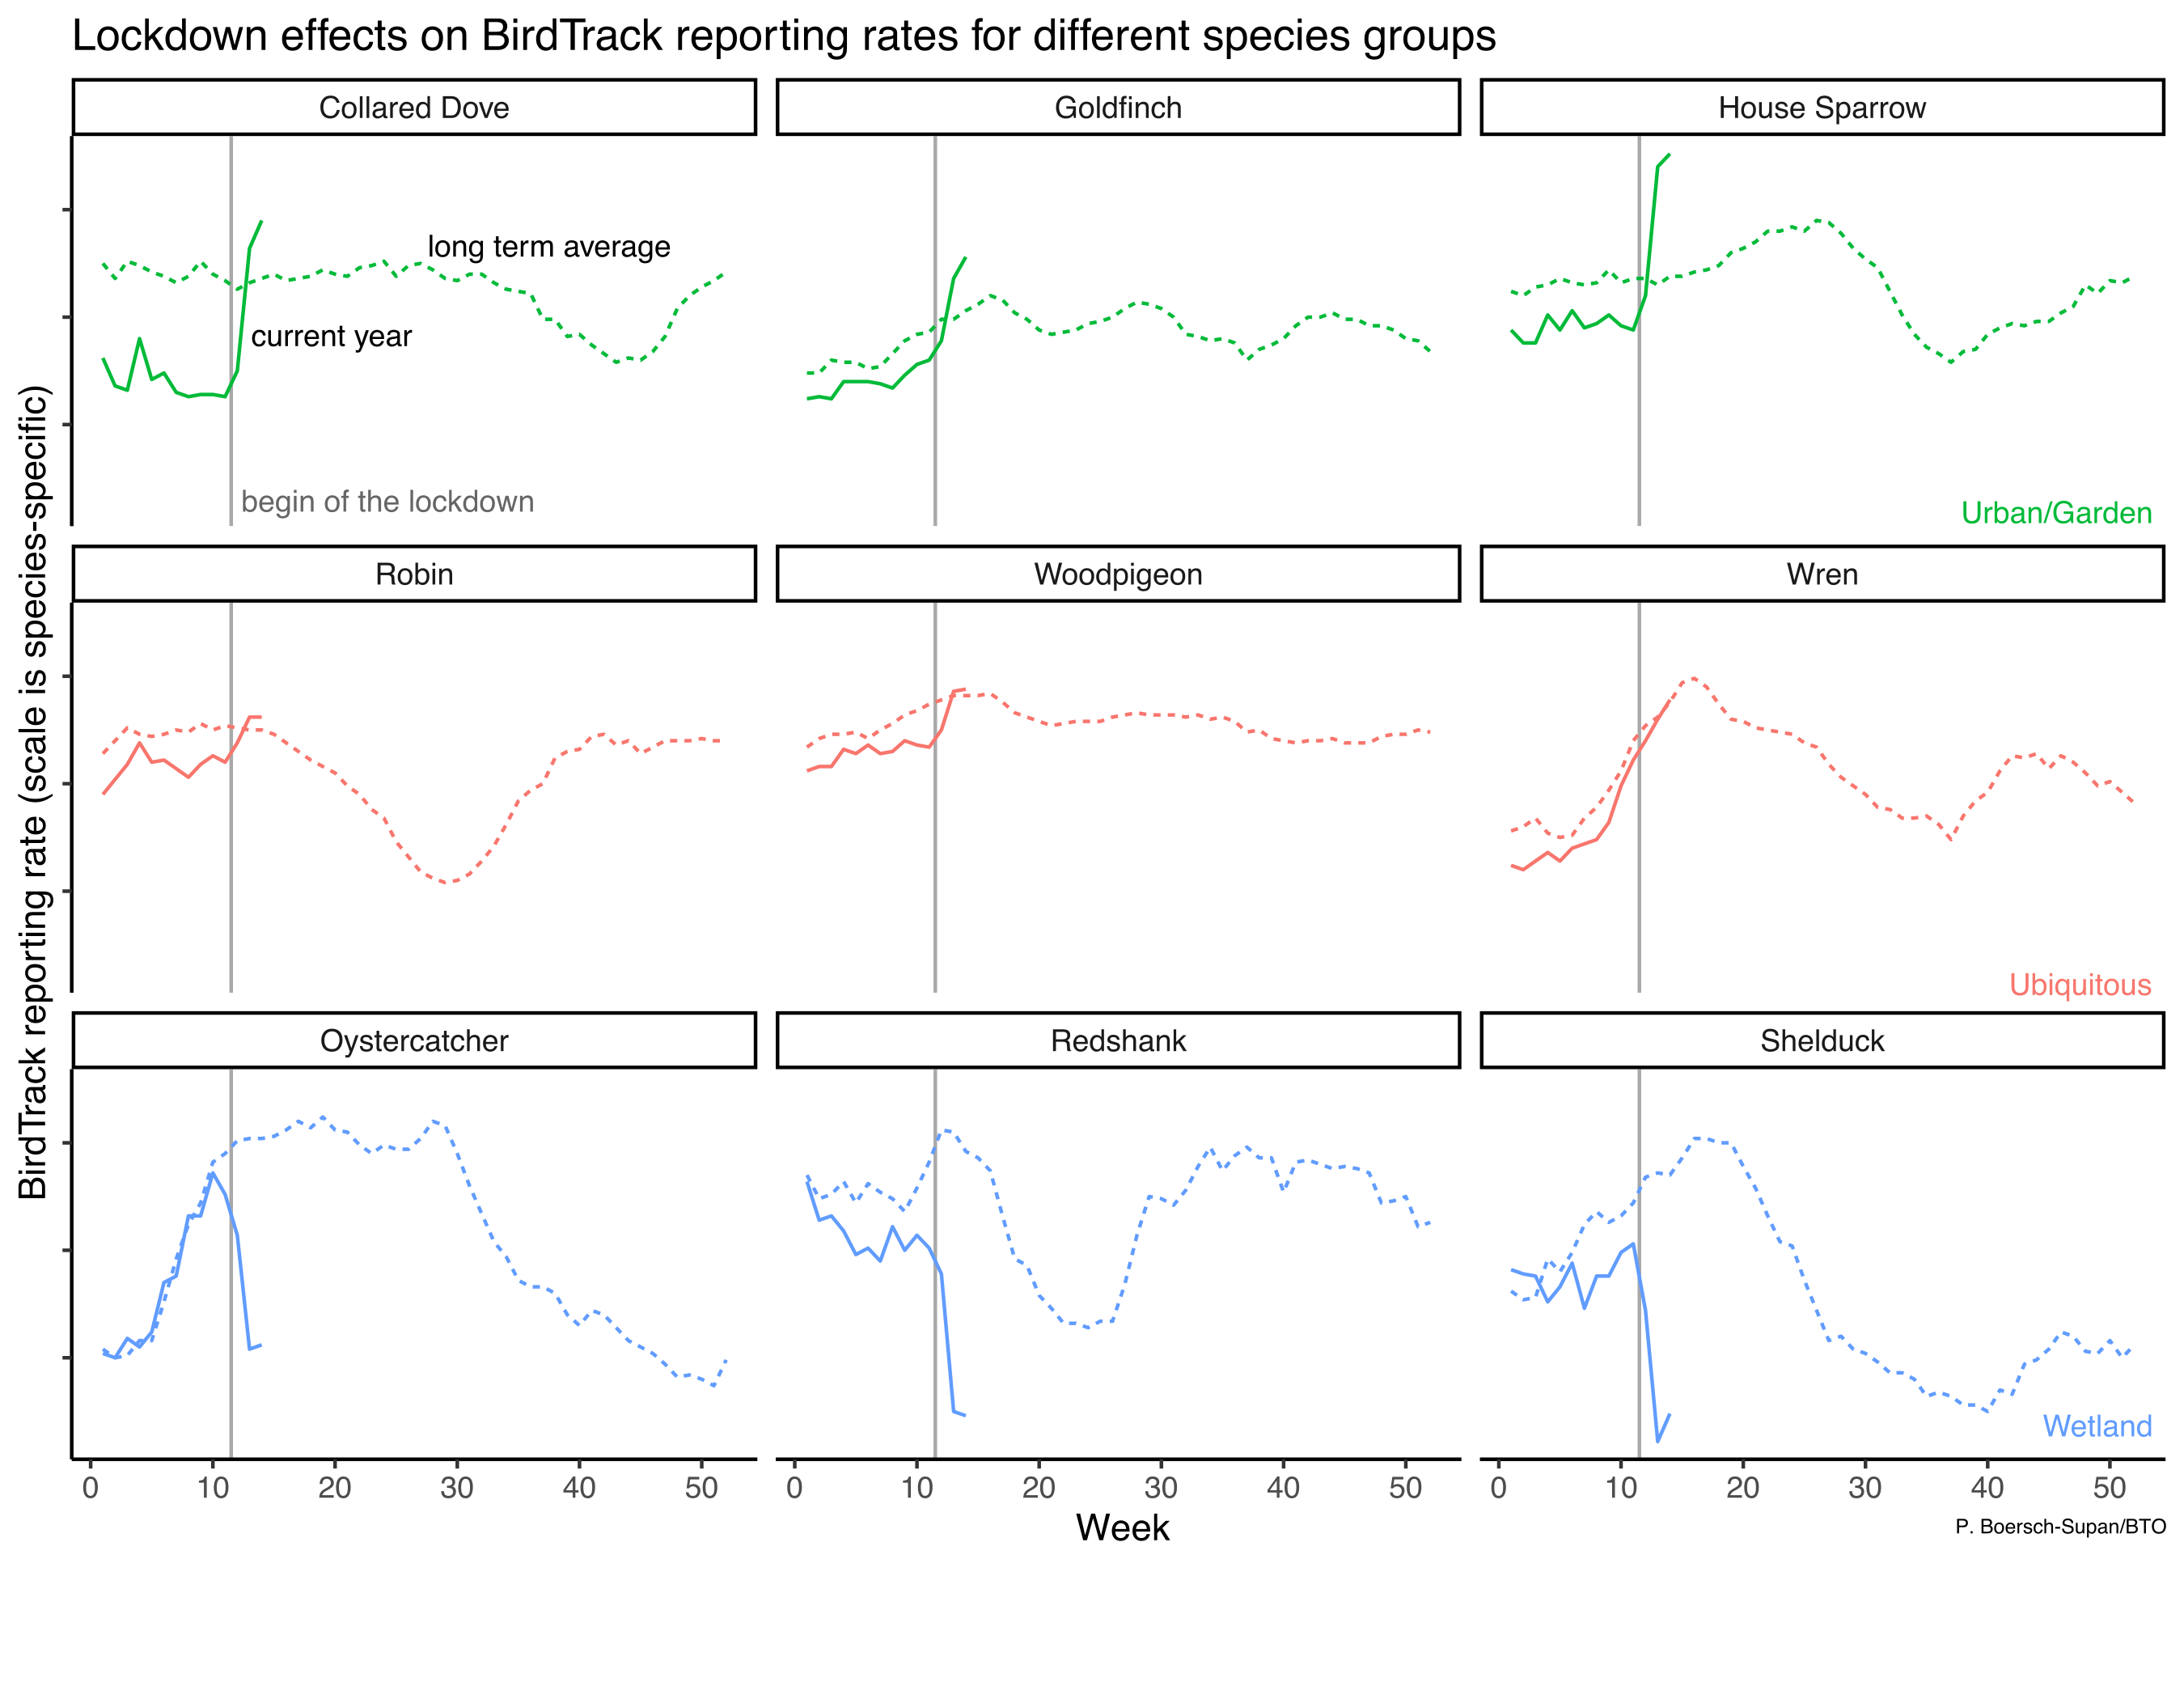
As we head into the fourth week of staying at home you may have noticed that the reporting rate trends on the BirdTrack website are starting to look rather unusual this year.
Since Mid-March there is a spike in reporting for House Sparrows, Oystercatcher reports are crashing, whilst for Wrens the reporting rate curve looks pretty normal.
In fact, this pattern is repeated across many species and broadly speaking there are three groups:
The perceived winners of the lockdown are birds which are common in human environments such as towns and gardens, the perceived losers are birds that are usually found further afield, particularly in wetlands and on the coast, and little change appears to have happened to a few species that are widespread and common across many habitat types.
Of course these graphs tell us much more about birder behaviour than about the birds themselves.
House Sparrow populations are unlikely to have changed much between the start and end of March and Oystercatchers are probably doing just as fine now as they did a fortnight ago.
What has changed, however, is the way we watch and record birds in these weeks.
As we are confined to our flats and houses, birdwatching is limited to what we can see from our windows, in our gardens, or on our daily walks close to home.
For most of us that doesn’t include wetland habitats or the seashore.
This drastic change in where we can go birdwatching is the underlying cause of the unusual reporting rate graphs on birdtrack.net.
They are simple summaries, calculated across all complete lists submitted in a given week.
The last two weeks everyone has been lockdown birding, while usually birdwatchers would be out and about at this time to track Spring migration.
Given these unusual circumstances, the simple reporting rate graphs are therefore not useful this year to compare year-on-year changes in the timing of migration or relative abundance of any given species.
While popular among birdwatchers for quick comparison, the simple reporting rate graphs were never intended to serve as a robust population assessment tool.
BirdTrack observations have always come from a biased set of locations – the places that birders like to visit.
Even before the current and extraordinary changes to birdwatching there have been subtle changes in where those places are.
For example, visits to urban sites have increased steadily since the inception of the scheme.
Such changes shift the composition of habitats represented in each year and make comparisons based on simple summaries increasingly difficult.
But fear not, funded by the BirdTrack Appeal, we have spent considerable effort in recent years to develop methods that allow us to use BirdTrack data regardless of the changes in observer behaviour.
Recent research by my predecessor, Alison Johnston, has demonstrated that we can statistically account for biases in BirdTrack data to obtain accurate information about bird distributions, and further work is underway by myself and my colleagues to extend these methods to look at temporal trends.
So while this year is unlike any other, do keep birding wherever you safely can – from your kitchen window or on your daily walk.
Our data visualisations have yet to catch up with the circumstances, but rest assured: now as ever, any submitted list is valuable information.
19 Feb 2020
Philipp Boersch-Supan
paper
Tweet this!
Thanks to a growing number of schemes and improvements in recording and reporting technology, biological recording is now happening in more places and more regularly than ever before. Interested members of the public, BTO volunteers among them, are recording a broad suite of wildlife from birds, to insects, to plants. Although these schemes, including those run by BTO, are united by the hard work of volunteers, not all recording schemes are created equally.
Read my full blog about insights from the BTO BirdTrack scheme on the BTO website.