Blog post - Lockdown effects on citizen science bird reporting rates
21 Apr 2020 Philipp Boersch-Supan citizen science Tweet this!This blog post was originally published on the BTO’s website
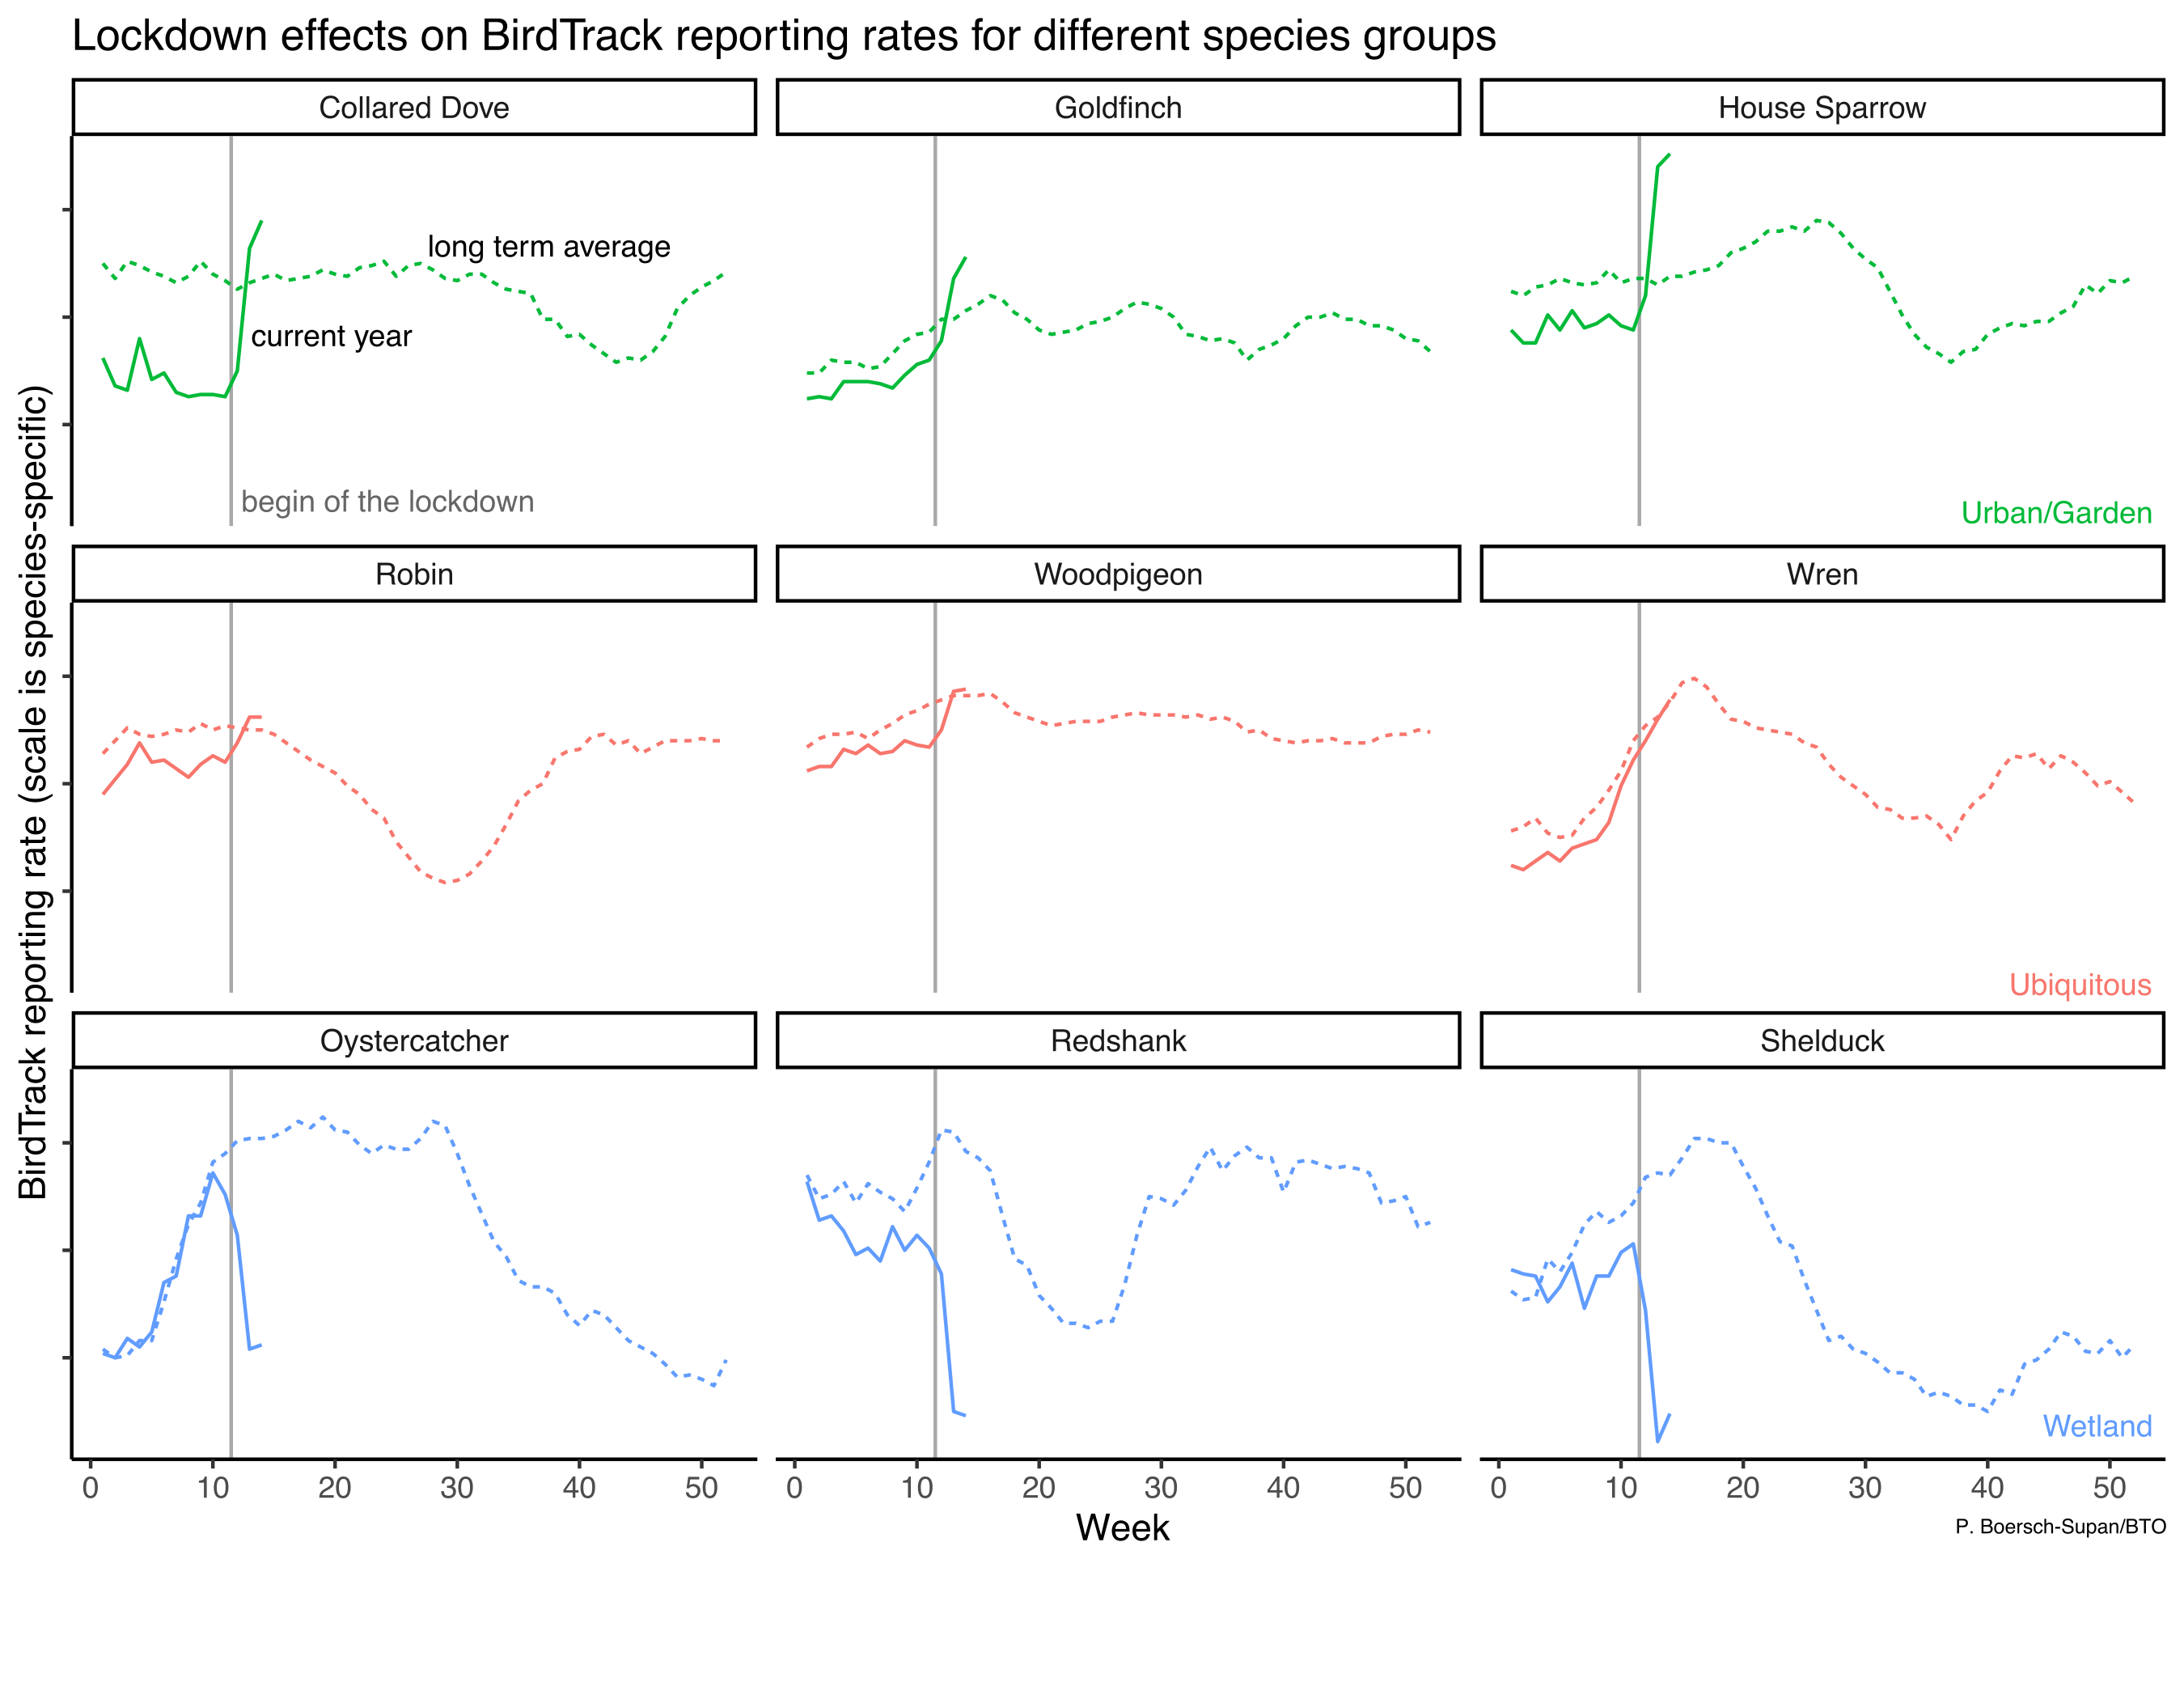
As we head into the fourth week of staying at home you may have noticed that the reporting rate trends on the BirdTrack website are starting to look rather unusual this year. Since Mid-March there is a spike in reporting for House Sparrows, Oystercatcher reports are crashing, whilst for Wrens the reporting rate curve looks pretty normal. In fact, this pattern is repeated across many species and broadly speaking there are three groups: The perceived winners of the lockdown are birds which are common in human environments such as towns and gardens, the perceived losers are birds that are usually found further afield, particularly in wetlands and on the coast, and little change appears to have happened to a few species that are widespread and common across many habitat types.
Of course these graphs tell us much more about birder behaviour than about the birds themselves. House Sparrow populations are unlikely to have changed much between the start and end of March and Oystercatchers are probably doing just as fine now as they did a fortnight ago. What has changed, however, is the way we watch and record birds in these weeks. As we are confined to our flats and houses, birdwatching is limited to what we can see from our windows, in our gardens, or on our daily walks close to home. For most of us that doesn’t include wetland habitats or the seashore. This drastic change in where we can go birdwatching is the underlying cause of the unusual reporting rate graphs on birdtrack.net. They are simple summaries, calculated across all complete lists submitted in a given week.
The last two weeks everyone has been lockdown birding, while usually birdwatchers would be out and about at this time to track Spring migration. Given these unusual circumstances, the simple reporting rate graphs are therefore not useful this year to compare year-on-year changes in the timing of migration or relative abundance of any given species. While popular among birdwatchers for quick comparison, the simple reporting rate graphs were never intended to serve as a robust population assessment tool. BirdTrack observations have always come from a biased set of locations – the places that birders like to visit.
Even before the current and extraordinary changes to birdwatching there have been subtle changes in where those places are. For example, visits to urban sites have increased steadily since the inception of the scheme. Such changes shift the composition of habitats represented in each year and make comparisons based on simple summaries increasingly difficult. But fear not, funded by the BirdTrack Appeal, we have spent considerable effort in recent years to develop methods that allow us to use BirdTrack data regardless of the changes in observer behaviour. Recent research by my predecessor, Alison Johnston, has demonstrated that we can statistically account for biases in BirdTrack data to obtain accurate information about bird distributions, and further work is underway by myself and my colleagues to extend these methods to look at temporal trends.
So while this year is unlike any other, do keep birding wherever you safely can – from your kitchen window or on your daily walk. Our data visualisations have yet to catch up with the circumstances, but rest assured: now as ever, any submitted list is valuable information.