Mapping one's academic career path
17 Feb 2018 Philipp Boersch-Supan rstats Tweet this!Yesterday I came across Gordon Pennycook’s tweet about moving in academia:
I've moved 4,500 miles (7,242 km) for academia.
— Gordon Pennycook (@GordPennycook) February 6, 2018
How far have you gone?
So given that there’s a transatlantic move coming up for me to take up my first permanent research position at the British Trust for Ornithology, I thought, why not figure this out quickly using R.
library(ggmap)# for geocoding and plotting
library(geosphere)# for distance calculations
library(knitr)# for making a nice table
I used ggmap::geocode to look up the coordinates of each station on my academic career path:
academic_places <- geocode(c(home = "Neustadt an der Weinstrasse",
                             undergrad = "Marburg an der Lahn",
                             masters_phd = "St Andrews, Fife",
                             phd = "Oxford, Oxfordshire",
                             postdoc1 = "Cambridge, UK",
                             postdoc2a = "Tampa, FL",
                             postdoc2b = "Gainesville, FL",
                             job = "Thetford"),
                           source = "dsk")
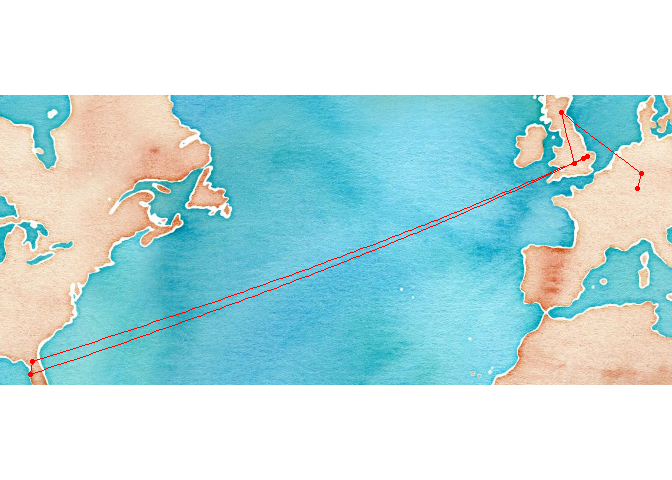
A quick plot to sanity check the locations
#make a map
qmplot(lon, lat, data = academic_places, maptype = "watercolor", color = I("red")) + geom_path(color = "red")
I then used the geosphere package to calculate sequential distance between stations
#calculate distances
distances_m <- distGeo(as.matrix(academic_places[,2:3]))

#transform units
distances_km <- distances_m/1000
distances_mi <- distances_m/1609
And lastly, I made a table to sum up everything.
#make a table
kable(data.frame(stage = c(academic_places[-1,1], "Total"),
                 distance_km = round(c(distances_km, sum(distances_km))),
                 distance_mi = round(c(distances_mi, sum(distances_mi)))))
| stage | distance_km | distance_mi |
|---|---|---|
| undergrad | 172 | 107 |
| masters_phd | 992 | 617 |
| phd | 516 | 321 |
| postdoc1 | 107 | 67 |
| postdoc2a | 7121 | 4426 |
| postdoc2b | 185 | 115 |
| job | 7005 | 4354 |
| Total | 16099 | 10006 |